
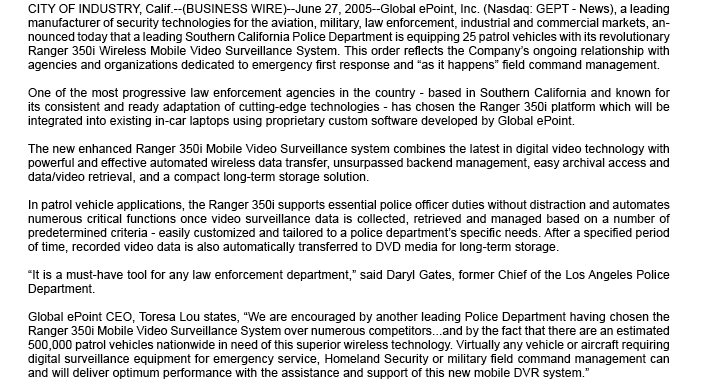
Global ePoint Reports Third Quarter 2005 Earnings
Third Quarter Revenue Increase 90%
Substantial Revenues From High Margin Proprietary Products and Services Anticipated During Fourth Quarter
CCITY OF INDUSTRY, Calif.--(BUSINESS WIRE)--Nov. 14, 2005--Global ePoint, Inc. (NASDAQ: GEPT - News), a developer of innovative security solutions for the aviation, homeland security and law enforcement markets, announced today third quarter results for the period ended September 30, 2005. The financial results include operations from the Company's Digital Technology, Aviation and Contract Manufacturing operations.
The Company reported revenue of $9.5 million, an increase of 90% over the $5.0 million recorded in the same period of 2004. The Company currently has a backlog of contracts and orders exceeding $16 million mostly in high margin proprietary products and services from its Aviation division. The timely delivery of these orders exclusive of additional contracts will ensure the profitability of the division during the fourth quarter and at least the next two quarters.
Global ePoint’s continued investment in research and development and the increased costs associated with being a public company resulted in a net loss of $(1.9) million in the third quarter of 2005, compared to a net loss of $(1.2) million for the 2004’s third quarter. Global ePoint had a net loss applicable to common stockholders of $(2.5) million or $(0.19) per share, compared to $(1.9) million or $(0.17) per share for the same period in 2004. The net loss applicable to common stockholders includes the quarter's operating net loss and non-cash dividends on preferred stock.
For the nine months ended September 30, 2005, Global ePoint had revenue of $20.1 million, compared to $14.0 million in the first nine months of fiscal 2004. The increase in revenue was due to higher revenue from the Company’s Perpetual Digital and Aviation businesses, along with higher contract manufacturing revenue.
Increased costs for research and development, sales, marketing and infrastructure costs related to the Perpetual Digital product line and the Aviation division resulted in a net loss of $(5.4) million for the first nine months of fiscal 2005, compared to a loss of $(3.1) million for the same period in fiscal 2004. The Company had a net loss applicable to common stockholders of $(7.3) million, or $(0.58) per share, compared to $(3.7) million, or ($0.34) per share for the nine months ended September 30, 2004. The 2005 net loss applicable to common stockholders is inclusive of the net operating loss and a non-cash dividend on preferred stock of $2.0 million.
"During the third quarter, we posted strong revenue gains in our contract manufacturing business. While we are pleased by the growth in the unit, we expect a shift toward higher margin products which will improve this unit’s operating results," said Toresa Lou, Global ePoint’s Chief Executive Officer.
"In our Aviation Division, we were working against a very strong comparable year ago quarter, when we were busy completing Cockpit Door Surveillance Systems ("CDSS") orders for our European customers," added Ms. Lou. "The later adoption of CDSS regulations here in the US has created a timing difference in when we expect that business to begin here. However, during the third quarter, the FAA issued its Notice of Proposed Rulemaking (’NPRM’) to require flight deck door surveillance systems, and we expect that systems will have to be installed in all US aircraft over a two year period, potentially beginning in early 2006."
In its NPRM, the FAA estimates the CDSS market to be worth $186 million in the US. We estimate the worldwide market including Europe, Canada, China, and Latin America to be more than double that amount. For this market as well as other orders Global ePoint expects in the near future, the Company began expanding its California-based facilities during the third quarter. Early in October, it opened a new Aviation Division facility in Tulsa, Oklahoma. During the third quarter, Global ePoint’s Aviation division received $11.8 million in new contracts. In our digital surveillance division," Ms. Lou continued, "we launched a pilot program with the Chicago Police Department for our wireless digital camera system, which is being tested as a replacement for the analog tape system now in use. Despite this success, we had a reduction of orders from one of our major customers in this division. We anticipate these orders to be back on schedule."
"With the CDSS and other proprietary aviation products and services we expect to improve the Company’s margins which will drive profitability" remarked Ms. Lou. "During the fourth quarter and 2006, as more homeland security initiatives are implemented and as a range of industries, including financial, law enforcement, hospitality and aviation, convert to or add digital systems, Global ePoint has positioned itself to be a leader through its innovative solutions."
Global ePoint designs, manufactures, sells and distributes digital video surveillance systems for the law enforcement, military, aviation and homeland security markets. On the cutting edge of digital technology, Global ePoint is developing new compression technologies and next-generation, secure network digital video systems and servers for a wide range of new markets, concentrating primarily on security and homeland defense applications. The Company also manufactures customized computing systems for industrial, business and consumer markets, as well as other specialized electronic products and systems. Complete vertical integration -- from design and manufacturing to sales and distribution -- allows the Company to capture efficiencies and maintain cost advantages in these growing markets, particularly homeland security. For more information, please visit http://www.globalepoint.com.
This news release contains forward-looking statements within the meaning of the Private Securities Litigation Reform Act of 1995. Such statements include, but are not limited to whether the Company will continue to move toward profitability, whether additional homeland security initiatives are implemented, whether Global ePoint’s technology will be used in other industries, and whether the company will complete key acquisitions. Such statements are subject to certain risks and uncertainties, and actual circumstances, events or results may differ materially from those projected in such forward-looking statements. Factors that could cause or contribute to differences include, but are not limited to, whether government agencies pass additional homeland security initiatives, whether businesses decide to use digital surveillance technology and if so, whether they will choose Global ePoint’s systems. Other risks include delays in the introduction of new products; further approvals of regulatory authorities, and the Company’s ability to obtain capital as and when needed. For a discussion of these and other factors that may cause actual events or results to differ from those projected, please refer to the Company’s most recent annual report on Form 10-KSB and quarterly reports on Form 10-QSB, as well as other subsequent filings with the Securities and Exchange Commission. The Company cautions readers not to place undue reliance on any forward-looking statements. The Company does not undertake, and specifically disclaims any obligation, to update or revise such statements to reflect new circumstances or unanticipated events as they occur.
For the three months ended September 30, 2005
($ in thousands)
| Digital Technology |
Aviation | Contract Manufacturing |
|||||||
| Net Sales | $ | 224 | $ | 707 | $ | 8,517 | |||
| Cost of sales | 154 | 450 | 7,857 | ||||||
| Gross profit | 70 | 257 | 660 | ||||||
| Operating Expenses | 878 | 561 | 742 | ||||||
| Income (loss) from operations | (808) | (304) | (82) | ||||||
| Other income (expense) | 1 | - | 2 | ||||||
| Income/(Loss) from operations | $ | (807) | $ | (304) | $ | (80) | |||
| Total assets as of September 30, 2005 | $ | 3,761 | $ | 6,210 | $ | 12,495 | |||
For the three months ended September 30, 2004 |
|||||||||
| Digital Technology |
Aviation | Contract Manufacturing |
|||||||
| Net Sales | $ | 447 | $ | 946 | $ | 3,606 | |||
| Cost of sales | 280 | 627 | 2,958 | ||||||
| Gross profit | 167 | 319 | 648 | ||||||
| Operating Expenses | 768 | 627 | 584 | ||||||
| Income (loss) from operations | (601) | (308) | 64 | ||||||
| Other income (expense) | (18) | - | 2 | ||||||
| Income/(Loss) from operations | $ | (619) | $ | (308) | $ | 66 | |||
| Total assets as of September 30, 2005 | $ | 2,699 | $ | 5,197 | $ | 6,726 | |||
For the nine months ended September 30, 2005 |
|||||||||
| Digital Technology |
Aviation | Contract Manufacturing |
|||||||
| Net Sales | $ | 966 | $ | 1,493 | $ | 17,641 | |||
| Cost of sales | 649 | 1,060 | 15,433 | ||||||
| Gross profit | 317 | 433 | 2,208 | ||||||
| Operating Expenses | 2,752 | 1,634 | 2,202 | ||||||
| Income (loss) from operations | (2,435) | (1,201) | 6 | ||||||
| Other income (expense) | 4 | - | 1 | ||||||
| Income/(Loss) from operations | $ | (2,431) | $ | (1,201) | $ | 7 | |||
| Total assets as of September 30, 2005 | $ | 3,761 | $ | 6,210 | $ | 12,495 | |||
For the nine months ended September 30, 2004 |
|||||||||
| Digital Technology |
Aviation | Contract Manufacturing |
|||||||
| Net Sales | $ | 727 | $ | 1,605 | $ | 11,649 | |||
| Cost of sales | 459 | 1,029 | 9,317 | ||||||
| Gross profit | 268 | 576 | 2,332 | ||||||
| Operating Expenses | 1,935 | 1,155 | 2,198 | ||||||
| Income (loss) from operations | (1,667) | (579) | 134 | ||||||
| Other income (expense) | (20) | - | (3) | ||||||
| Income/(Loss) from operations | $ | (1,687) | $ | (579) | $ | 131 | |||
| Total assets as of September 30, 2005 | $ | 2,699 | $ | 5,197 | $ | 6,726 | |||
For the three months ended September 30, 2005 ($ in thousands) |
|||||||||
| Corporate | Total | ||||||||
| Net Sales | $ | — | $ | 9,448 | |||||
| Cost of sales | — | 8,461 | |||||||
| Gross profit | — | 987 | |||||||
| Operating Expenses | 699 | 2,880 | |||||||
| Income (loss) from operations | (699) | (1,893) | |||||||
| Other income (expense) | 16 | 19 | |||||||
| Income/(Loss) from operations | $ | (683) | $ | (1,874) | |||||
| Total assets as of September 30, 2005 | $ | 5,795 | $ | 28,261 | |||||
For the three months ended September 30, 2004 |
|||||||||
| Corporate | Total | ||||||||
| Net Sales | $ | — | $ | 4,999 | |||||
| Cost of sales | — | 3,865 | |||||||
| Gross profit | — | 1,134 | |||||||
| Operating Expenses | 371 | 2,350 | |||||||
| Income (loss) from operations | (371) | (1,216) | |||||||
| Other income (expense) | — | (16) | |||||||
| Income/(Loss) from operations | $ | (371) | $ | (1,216) | |||||
| Total assets as of September 30, 2005 | $ | 4,742 | $ | 19,364 | |||||
For the nine months ended September 30, 2005 |
|||||||||
| Corporate | Total | ||||||||
| Net Sales | $ | — | $ | 20,100 | |||||
| Cost of sales | — | 17,142 | |||||||
| Gross profit | — | 2,958 | |||||||
| Operating Expenses | 1,754 | 8,342 | |||||||
| Income (loss) from operations | (1,754) | (5,384) | |||||||
| Other income (expense) | 16 | 21 | |||||||
| Income/(Loss) from operations | $ | (1,738) | $ | (5,384) | |||||
| Total assets as of September 30, 2005 | $ | 5,795 | $ | 28,261 | |||||
For the nine months ended September 30, 2004 |
|||||||||
| Corporate | Total | ||||||||
| Net Sales | $ | — | $ | 13,981 | |||||
| Cost of sales | — | 10,805 | |||||||
| Gross profit | — | 3,176 | |||||||
| Operating Expenses | 1,063 | 6,351 | |||||||
| Income (loss) from operations | (1,063) | (3,176) | |||||||
| Other income (expense) | 145 | 122 | |||||||
| Income/(Loss) from operations | $ | (918) | $ | (3,053) | |||||
| Total assets as of September 30, 2005 | $ | 4,742 | $ | 19,364 | |||||
Global ePoint, Inc.
 |
|
|
 |
|
|
 |
|
|
 |
|
|
|
|
||
 |
|
|